Senior Data Analyst at Itau Unibanco and creator of one of the best sellers and top rated SQL courses at Udemy.
Expert in SQL, Excel and presentation design in general. Can handle Python and R if necessary.
This portfolio hosts the projects I worked on throught my learning journey, if you have any questions feel free to contact me.
ResumeCurso 100% prático com 2 projetos completos e mais de 50 exercícios para fixar o conhecimento adquirido. Esse curso foca no que é importante para se tornar um(a) Analista de Dados de sucesso: todos os exercícios foram desenhados para simular problemas reais do dia a dia dos analistas. Inscreva-se pelo link e garanta já a sua vaga com desconto! [SQL]
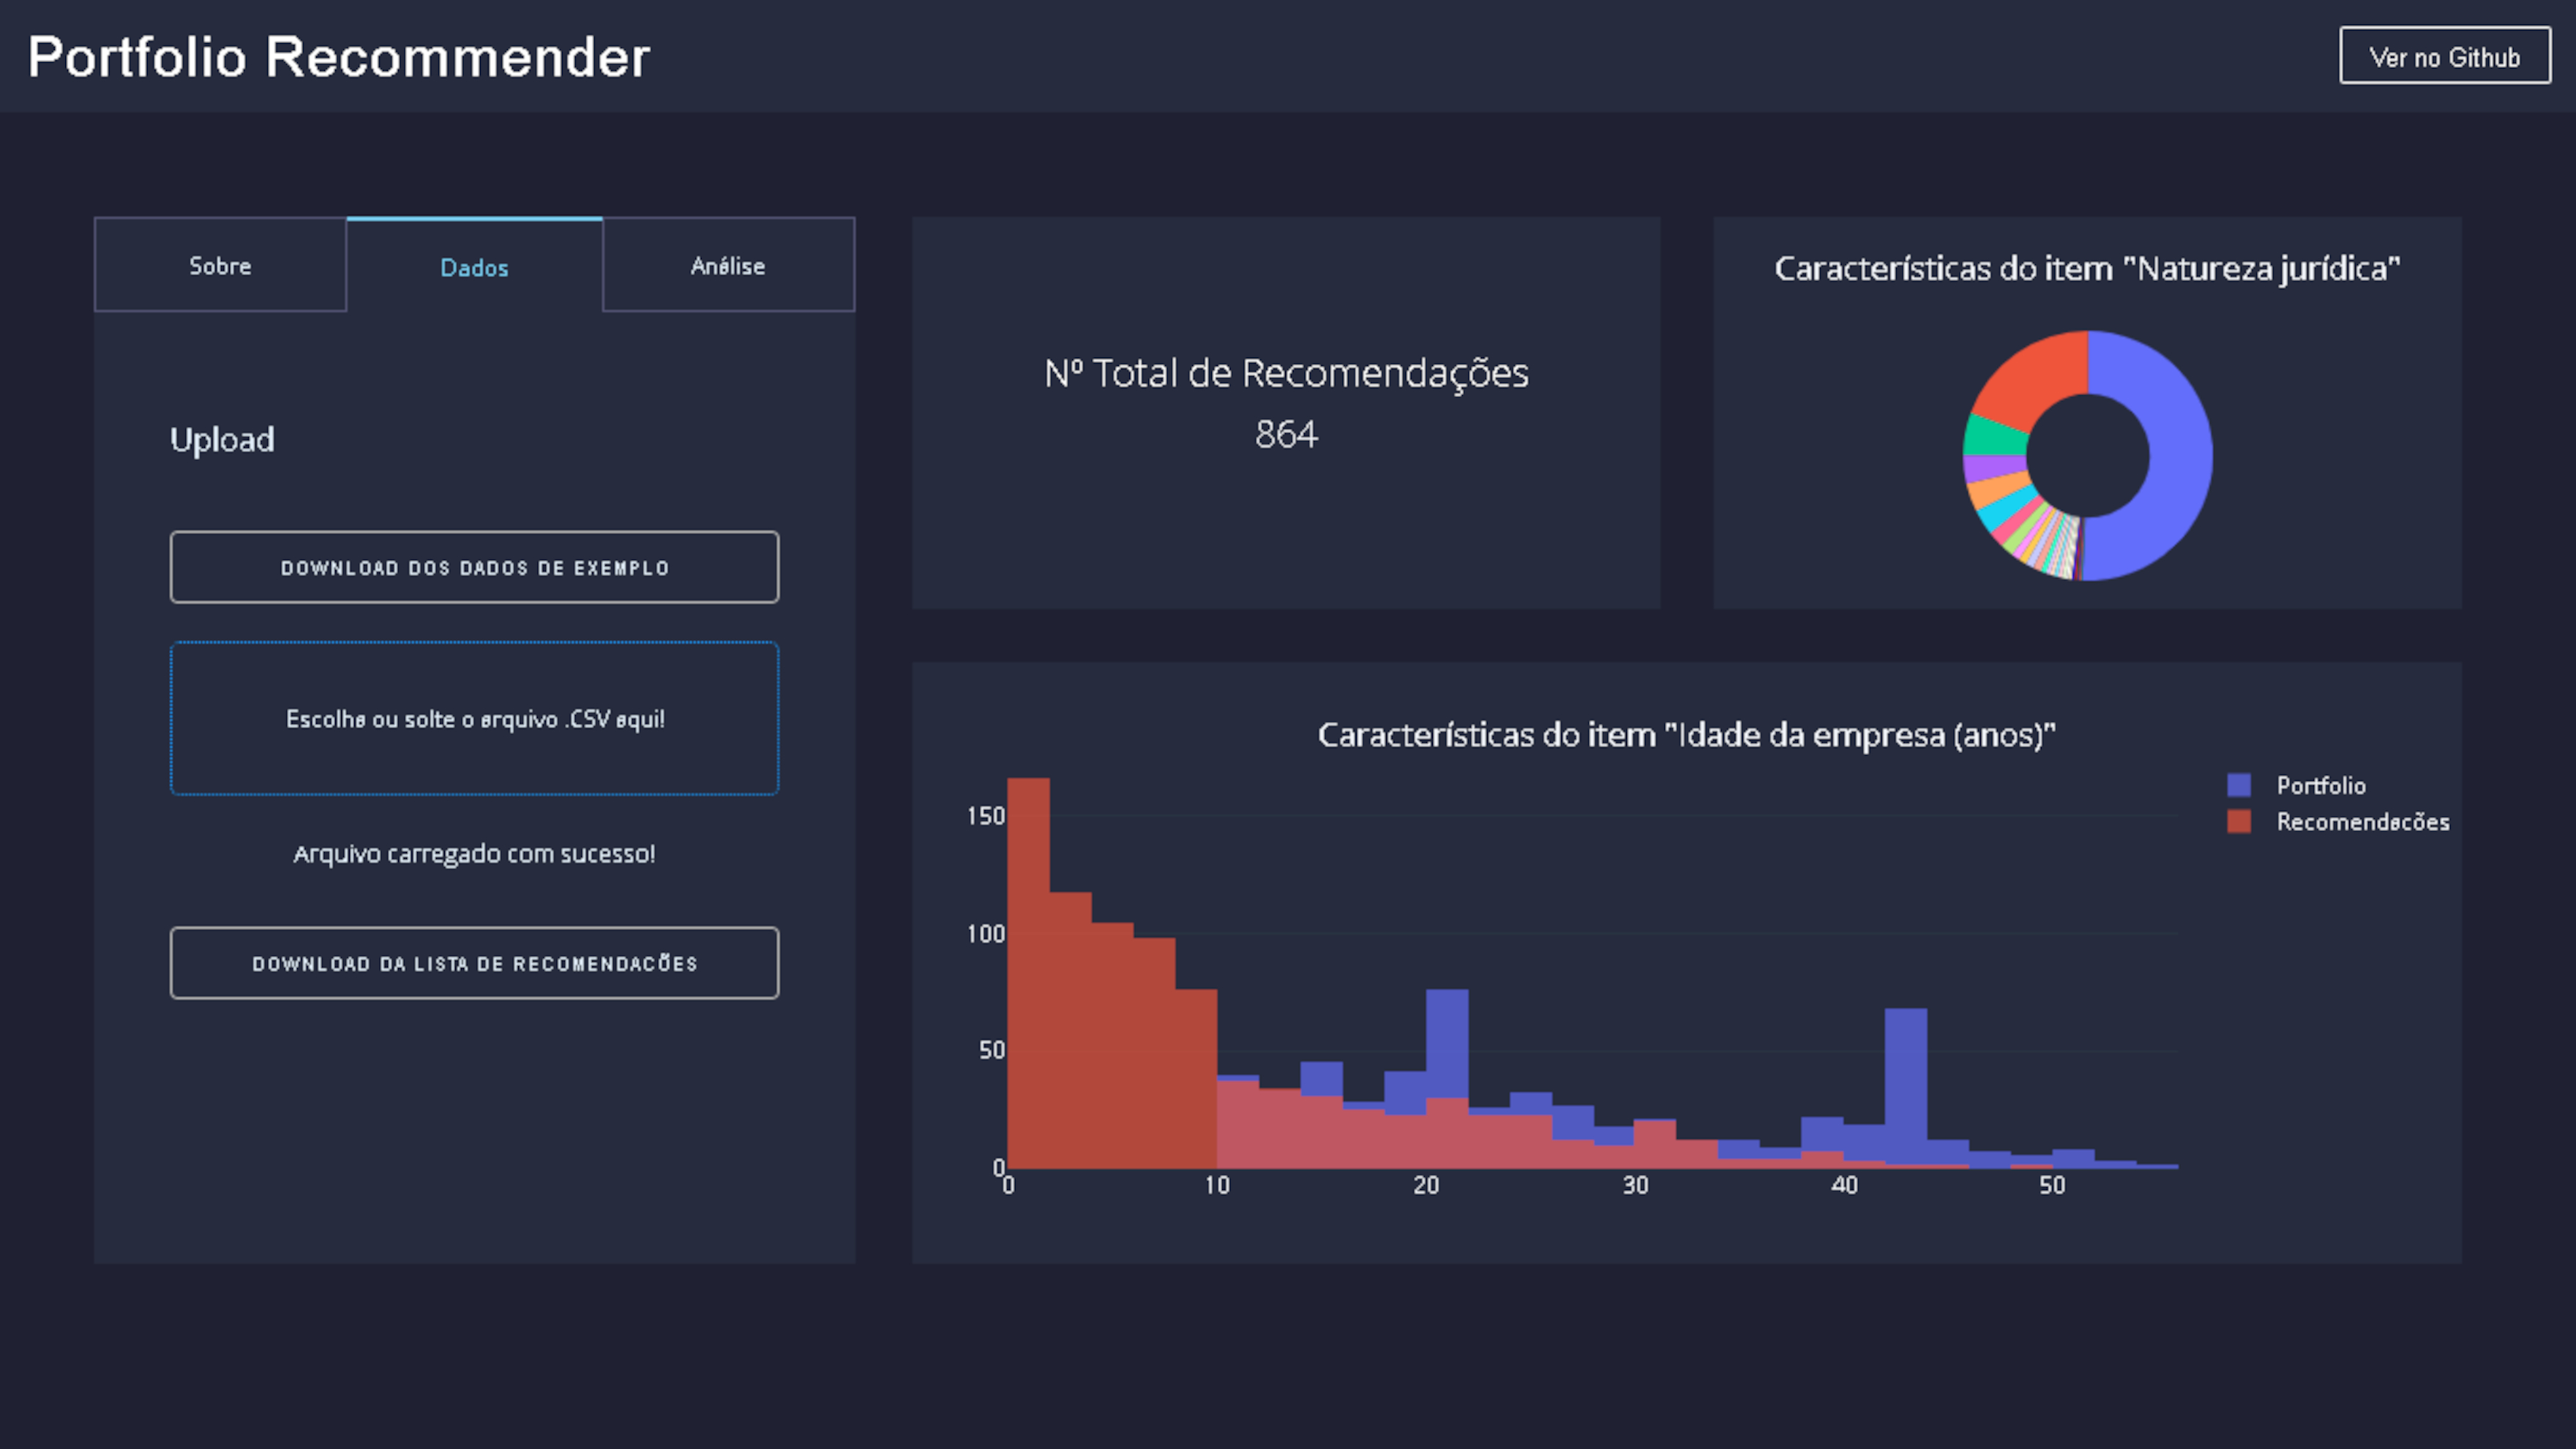
Portfolio Recommender is a web application that helps compannies to find leads that match their portfolio's characteristics. The company must insert a list with it's clients ids and the app will return a list with similar clients found in the market. The model was trained using the OneClassSVM algorithm and the interface was built with Dash and deployed in Heroku. Check it out! [python] [plotly] [ML] [dataviz]
My Twitter Data is an app that helps you to analyse your personal Twitter account, without having to install any software in your machine. It is online and totaly free. If you don't have a Twitter account but still want to check the app's functionalities, don't worry! At the site I provide a mock data sample for you to play around with. I developed the app in python using the streamlit library, feel free to check the code in the link bellow! [python] [streamlit] [dataviz]
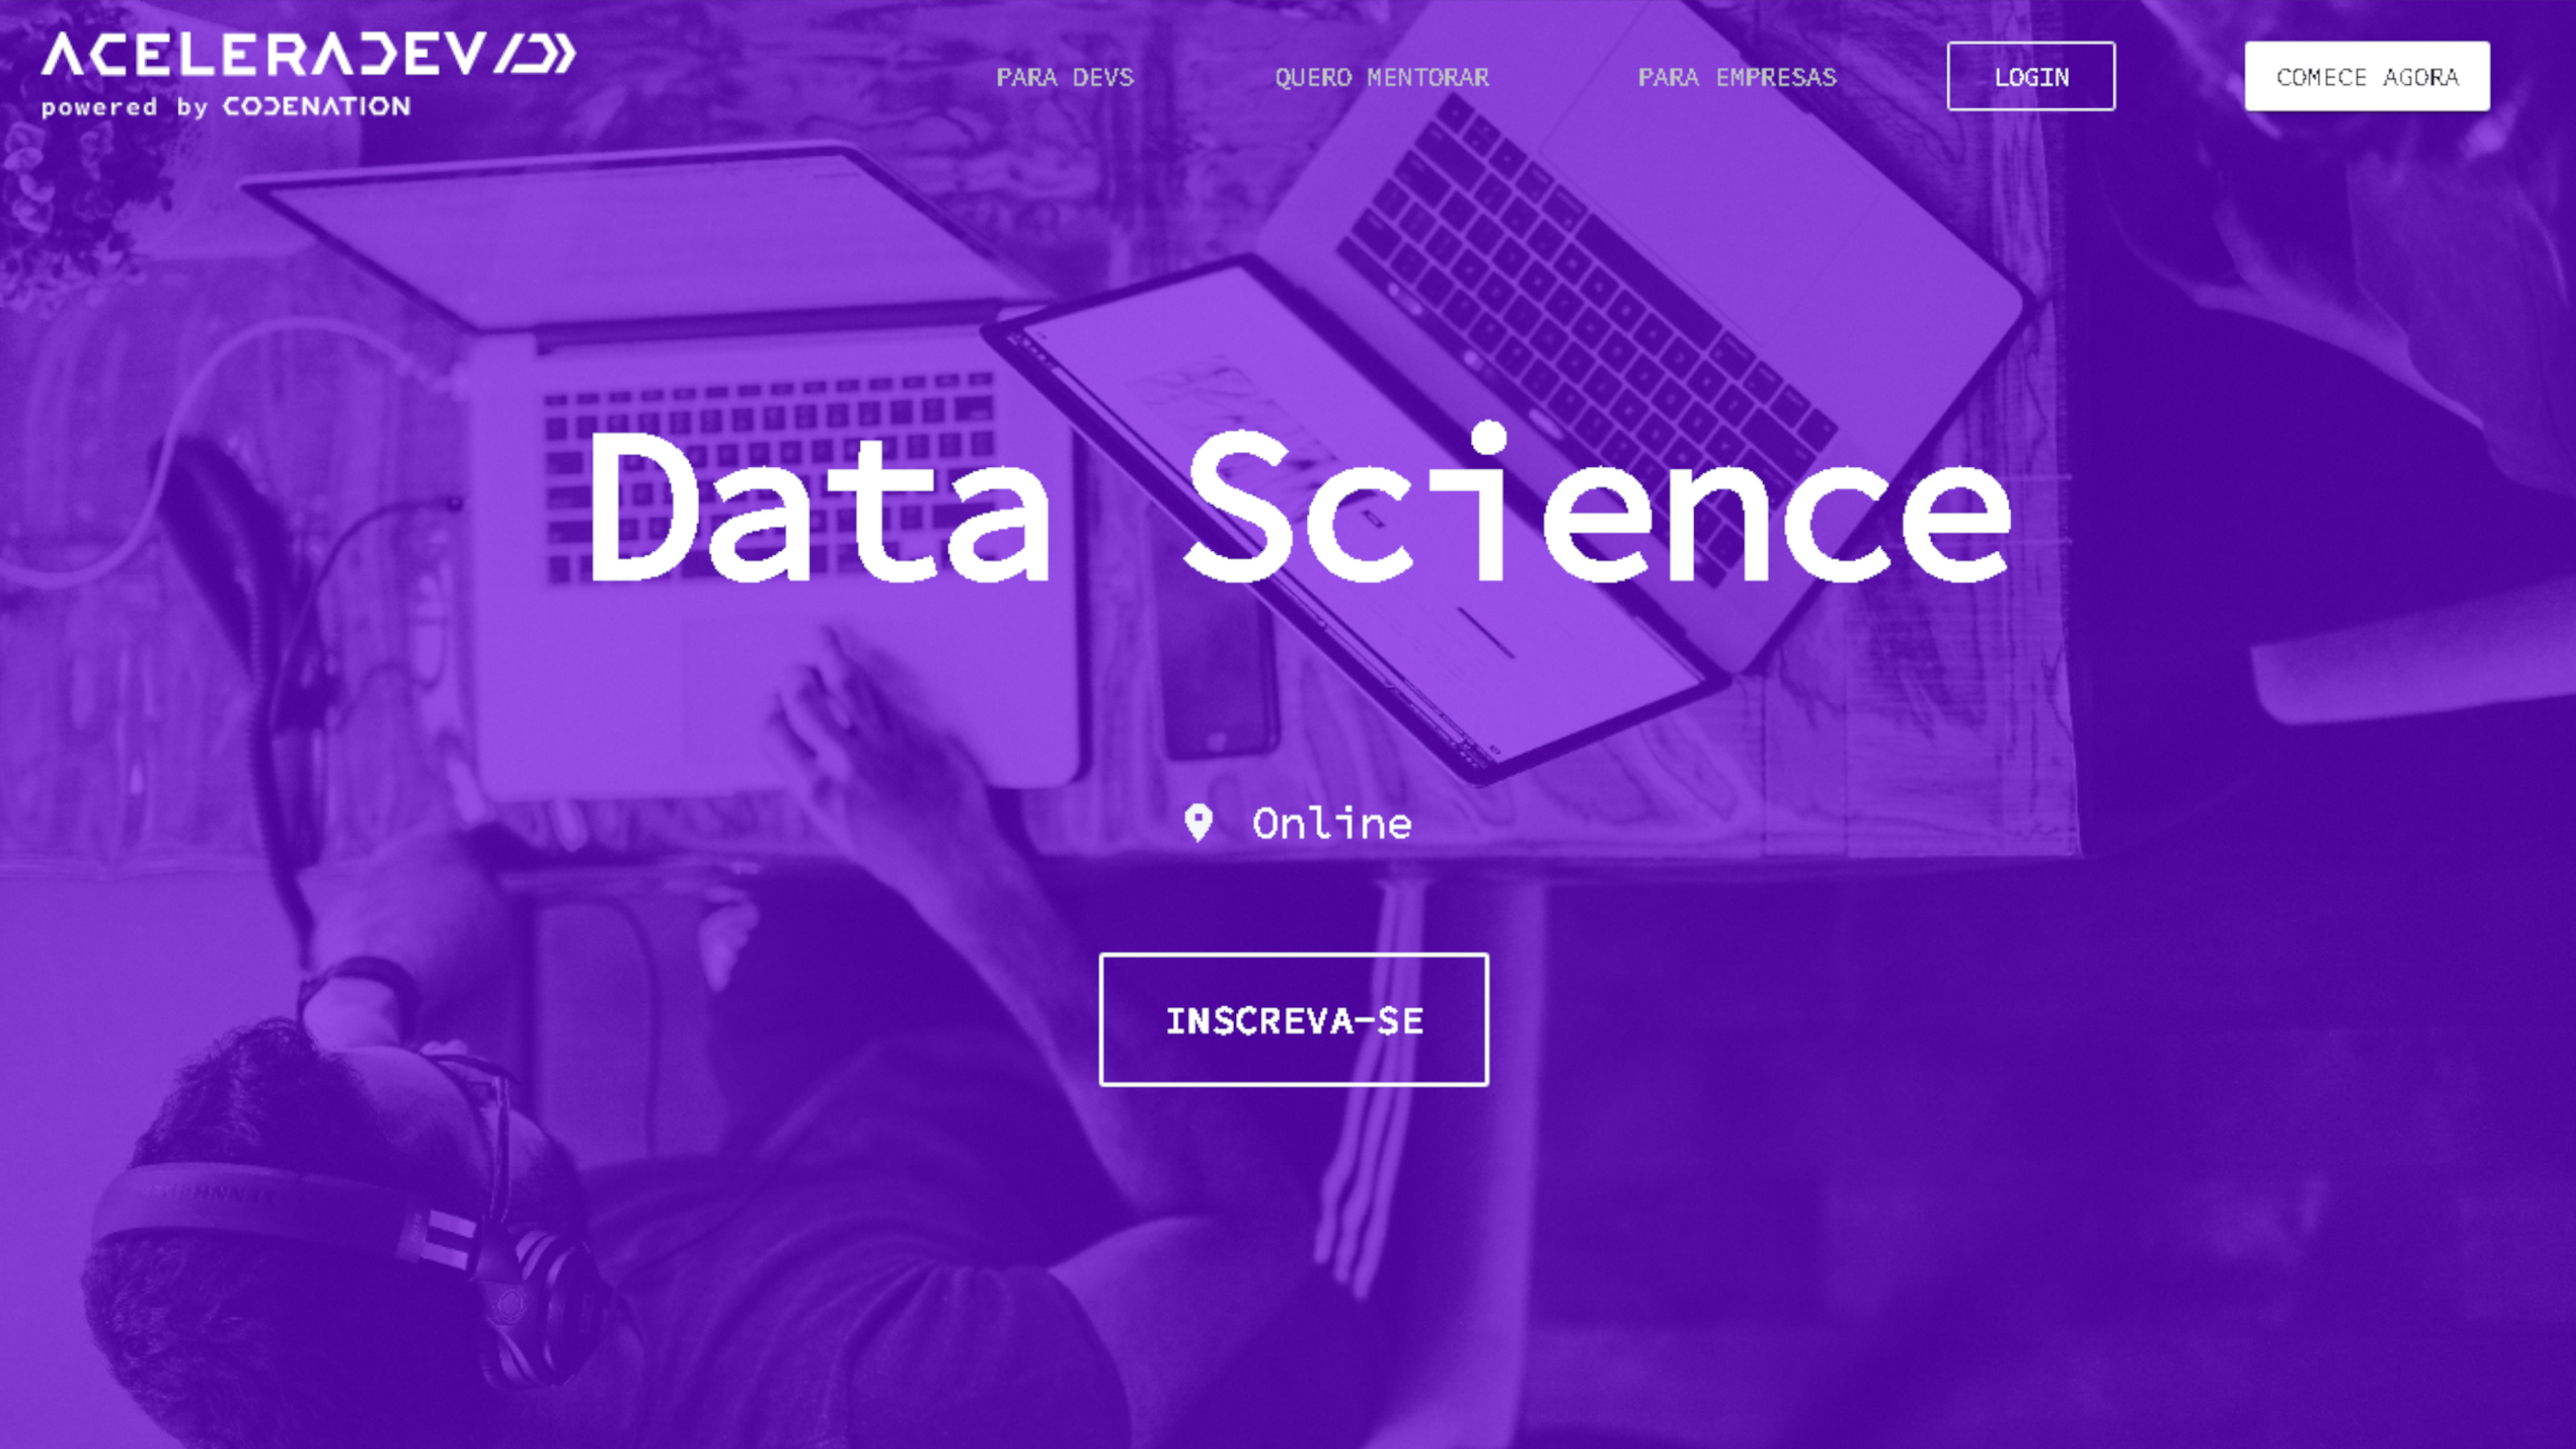
This is my proposed solution for the Codenation Data Science Challenge to enter the AceleraDev program. In this project, we had to predict the math grades of students who took the Brasilian National Exam (ENEM), using the other subjects grades to build up a model. Instead of building one model, I built 6 different models and compared their results to see which one of them could make the best predictions. [python] [ML]
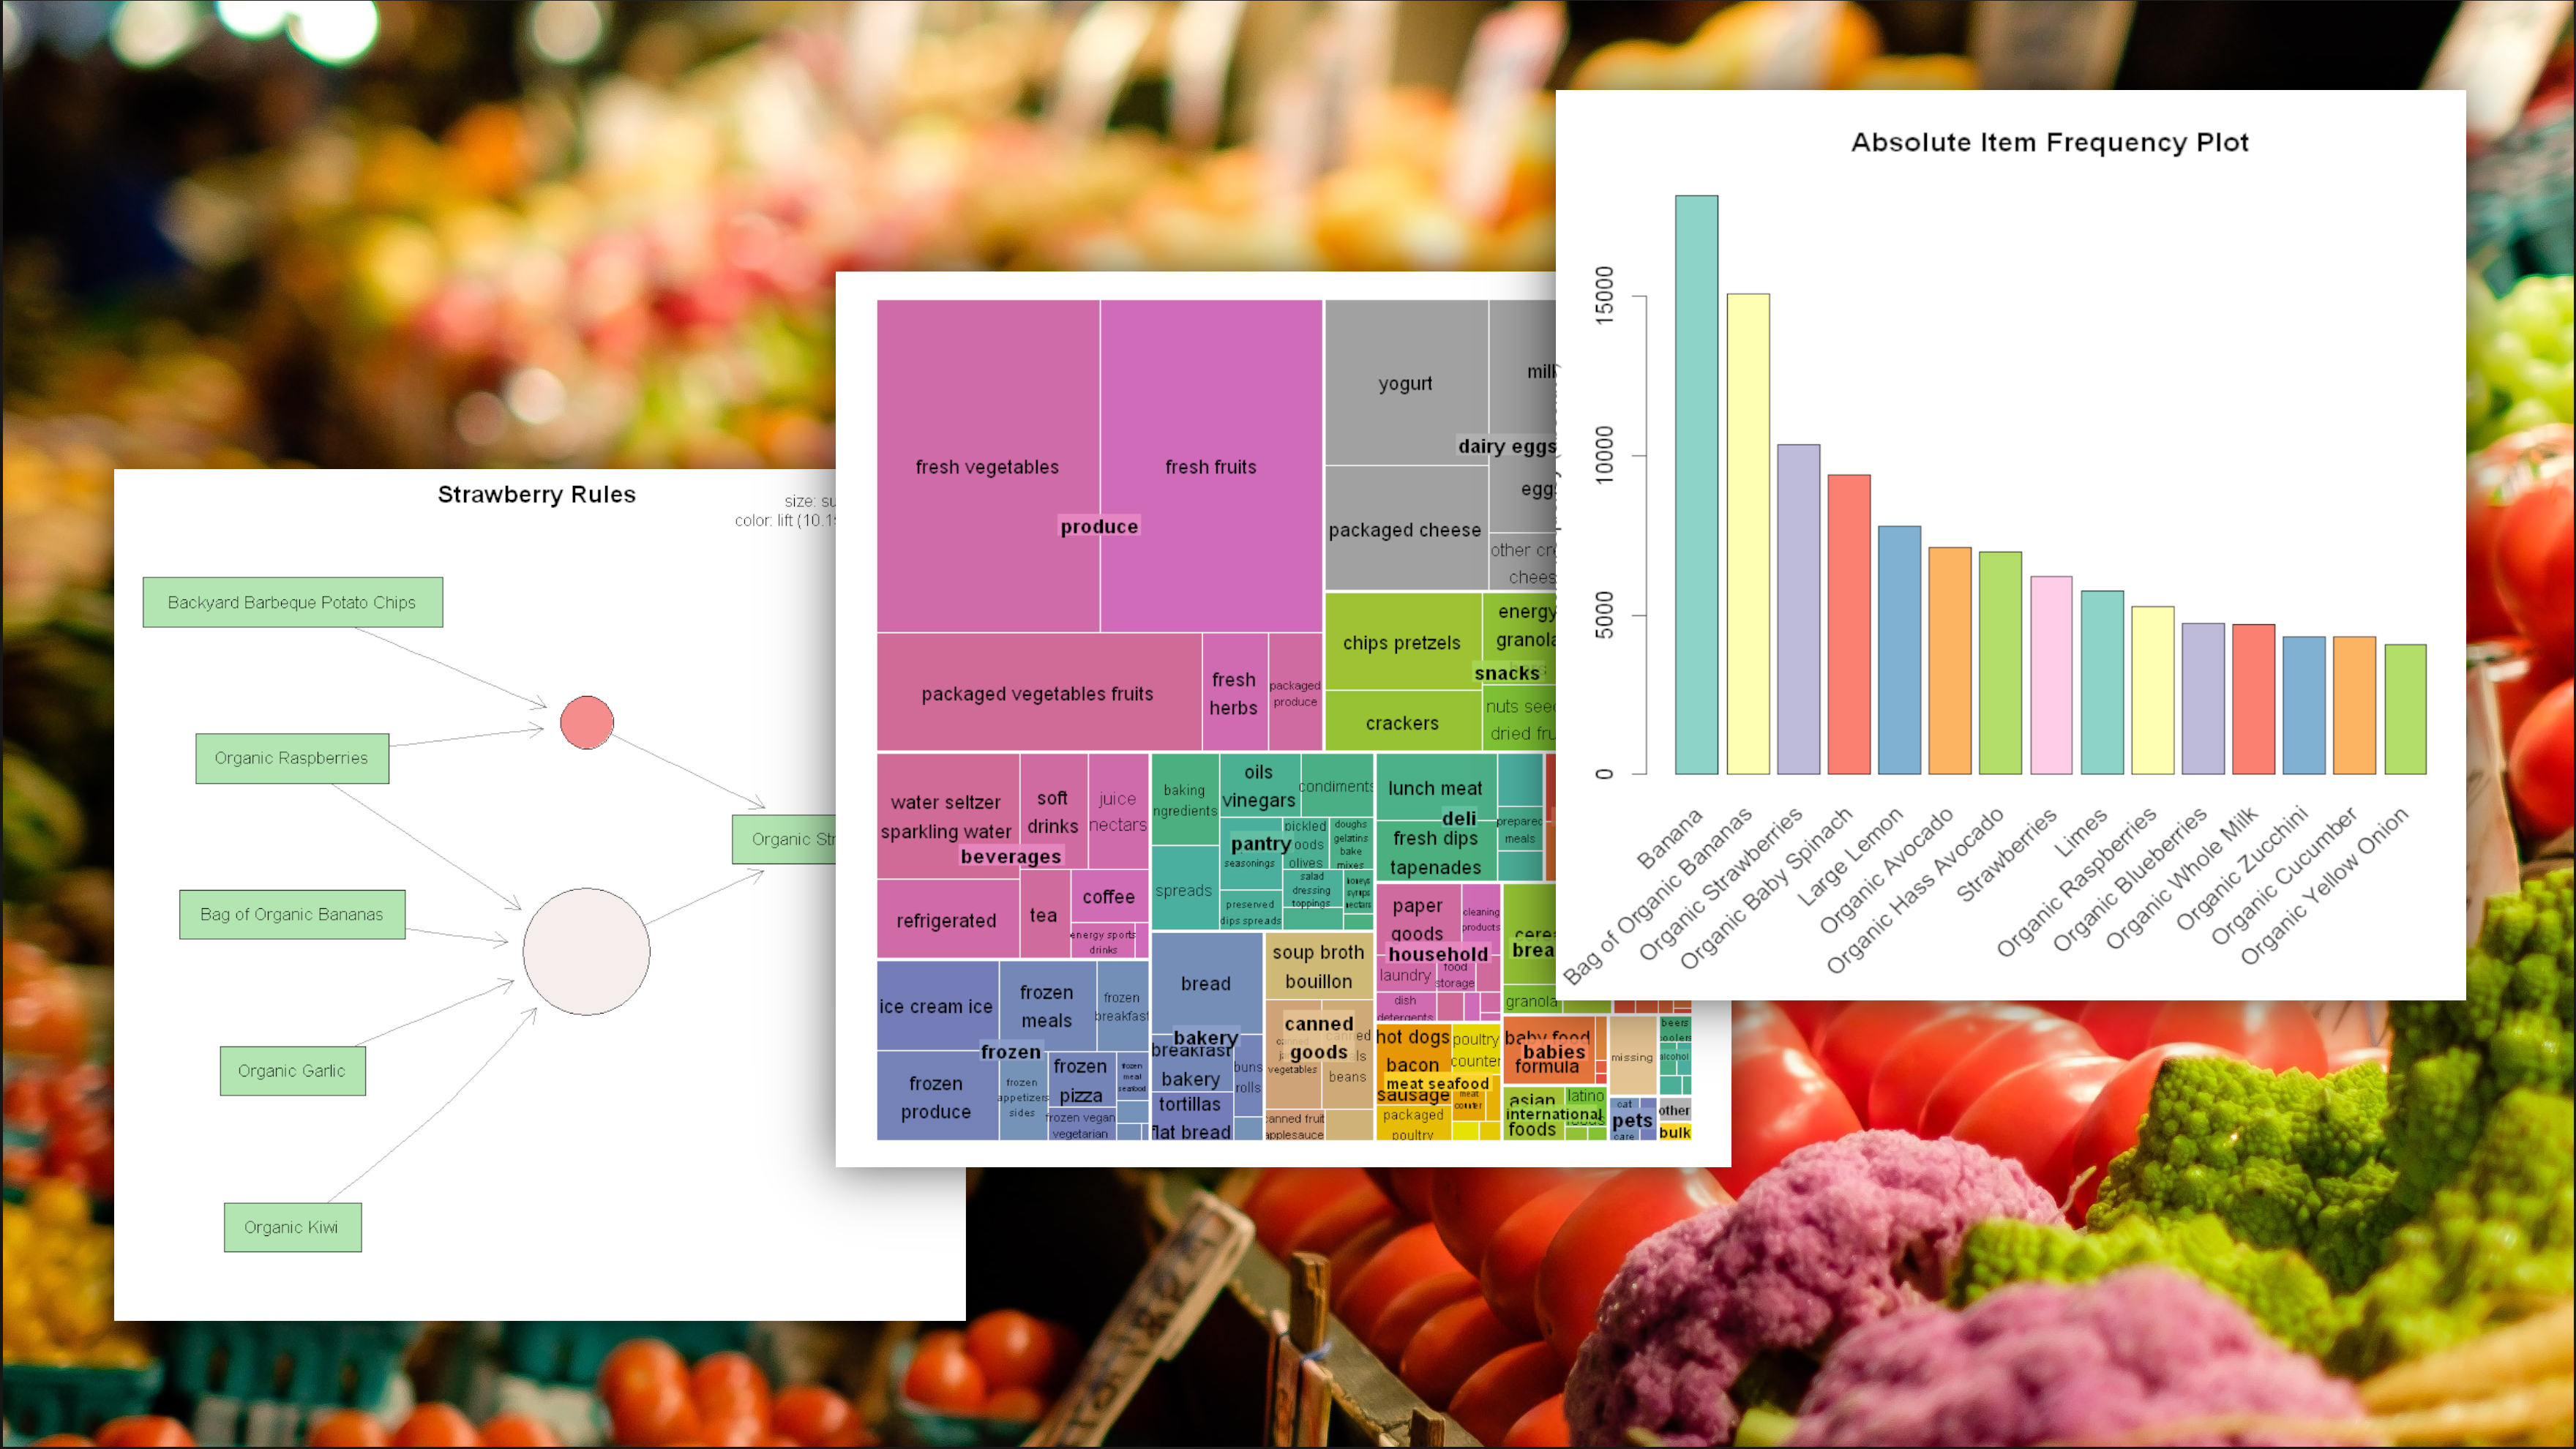
This is the second part of the Market Basket Analysis project proposed by the Data Science Academy in the Business Analytics course. Here I do an exploratory analysis using the APRIORI algorithm, a powerful tool to understand your customers shopping patterns: what products they buy, in which order and then answer the question: "What products could we offer to improve their experience?" [R] [EDA]
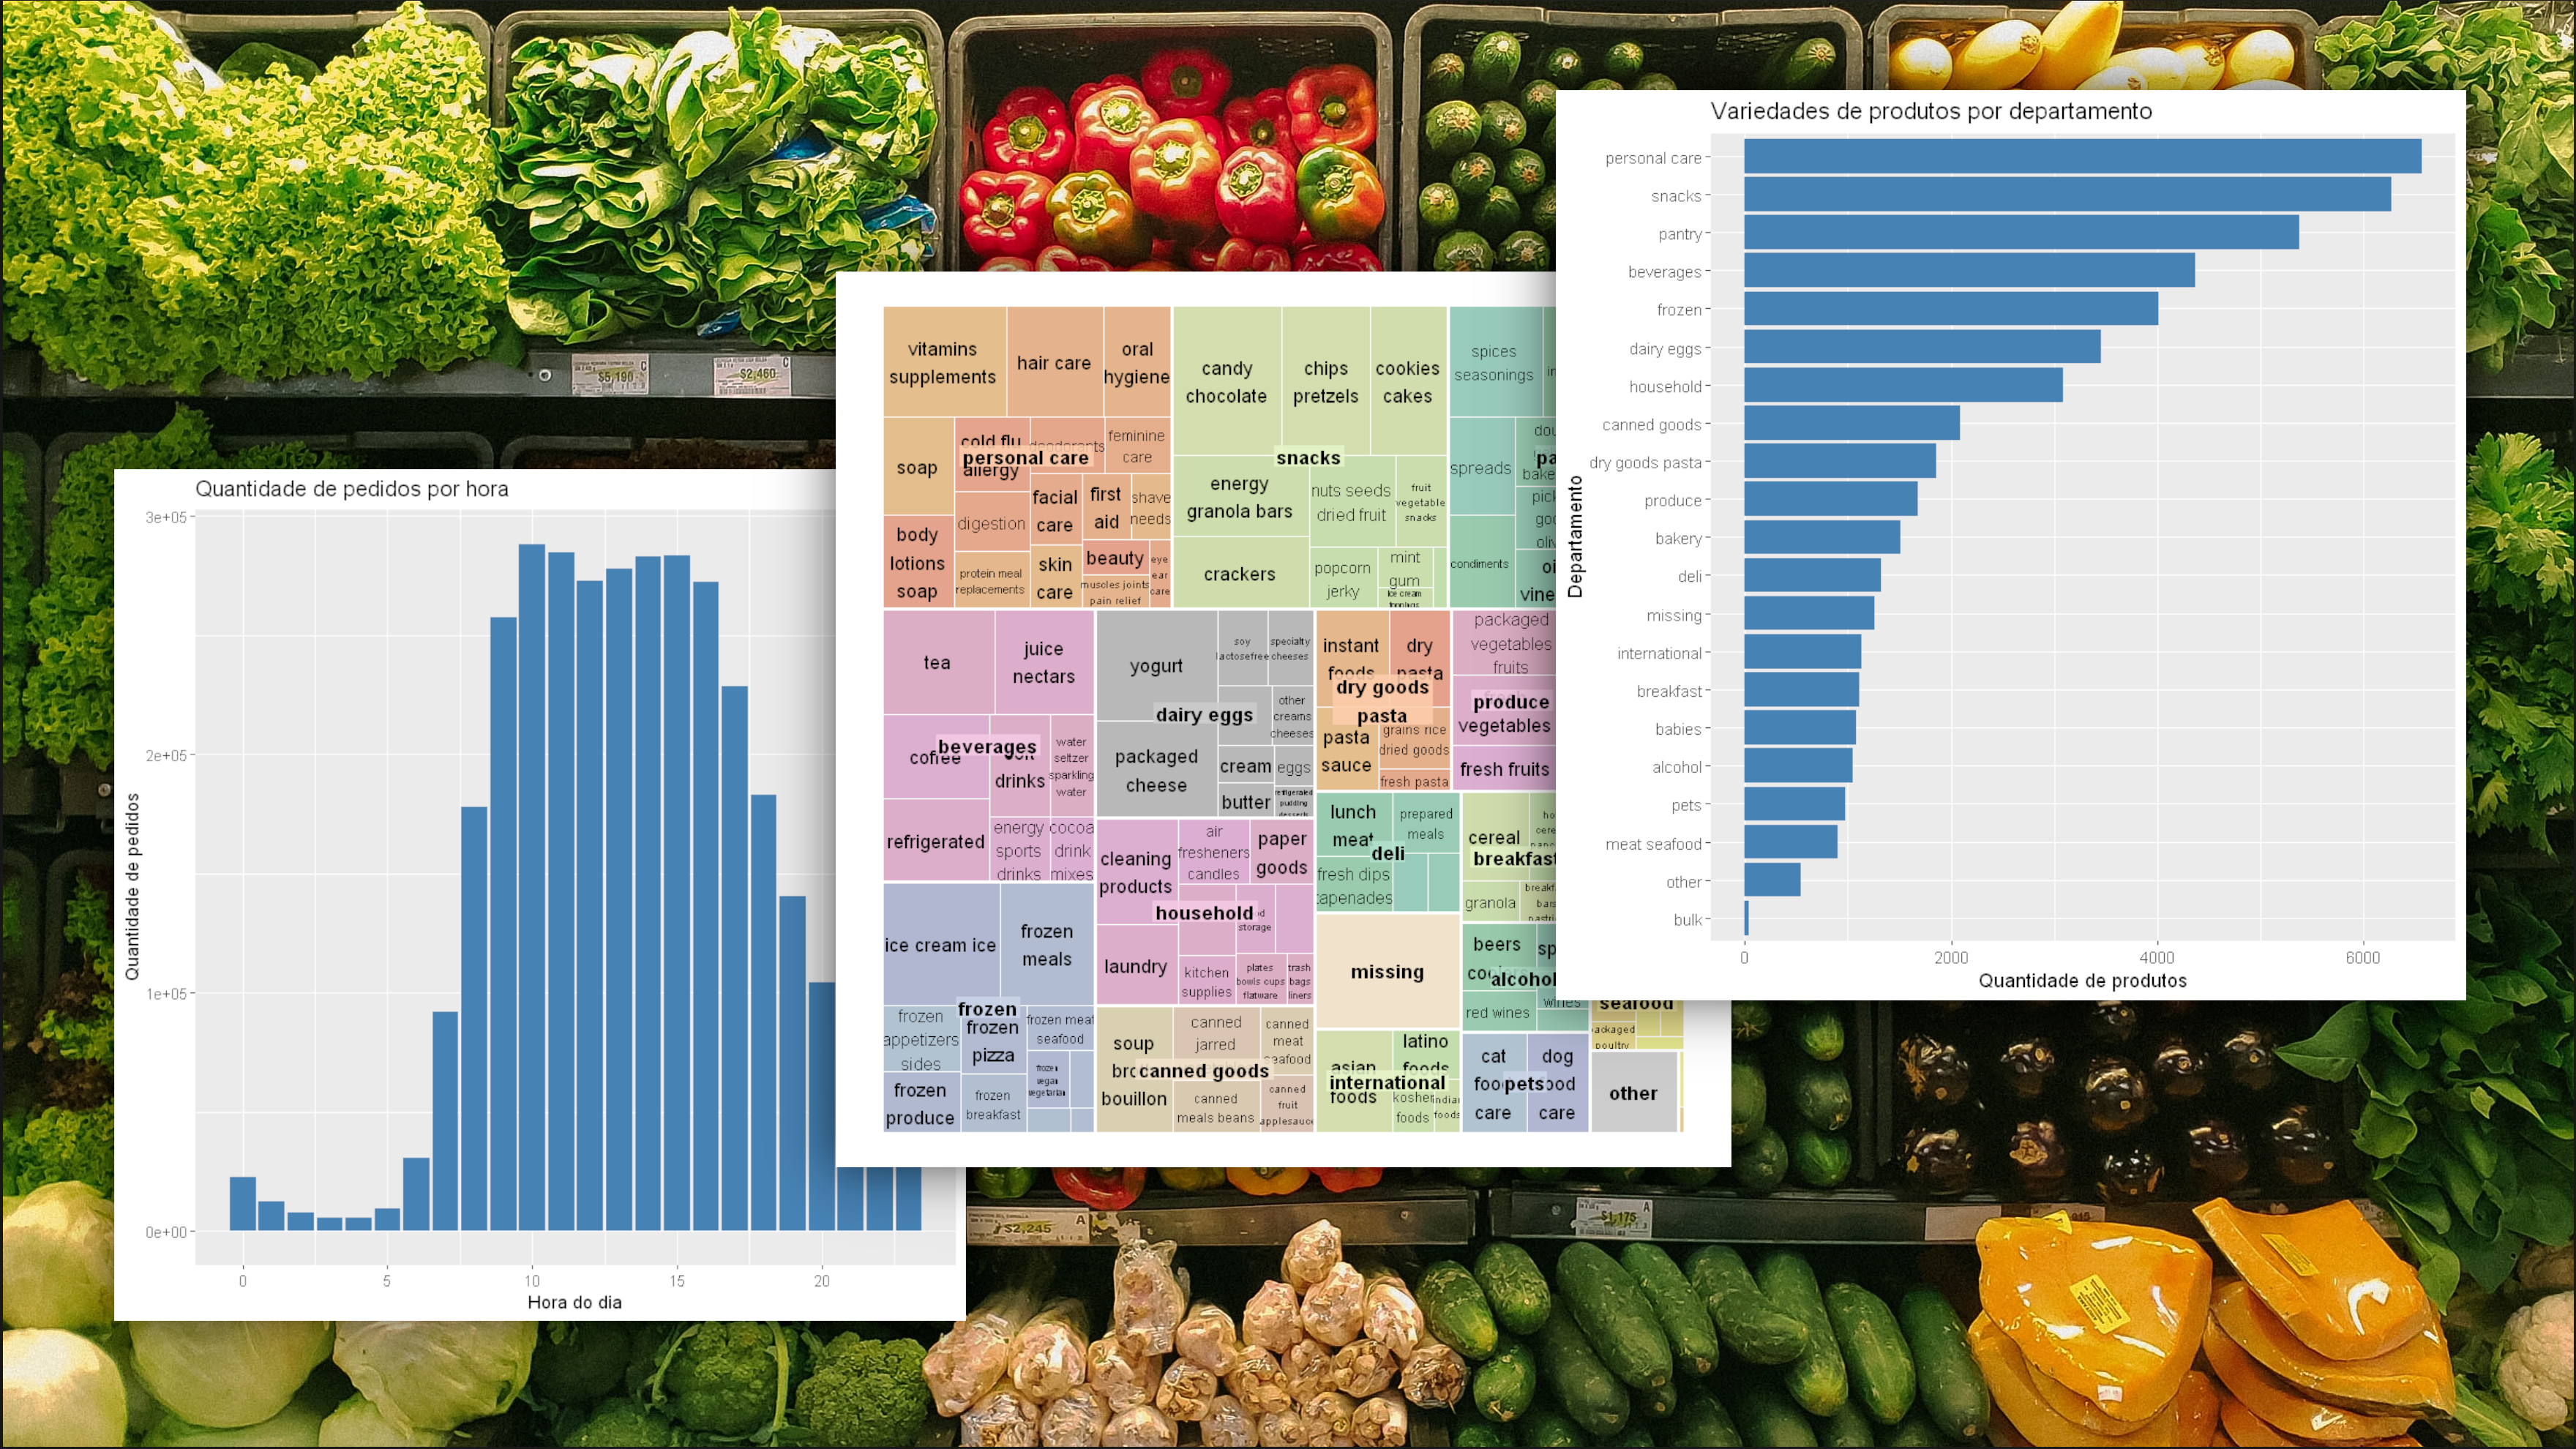
This is the first part of the Market Basket Analysis project proposed by the Data Science Academy in the Business Analytics course. Here I do an exploratory analysis in the dataset provided by Instacart, an app for online shopping, to provide insights about the buying patterns of the customers. [R] [EDA]
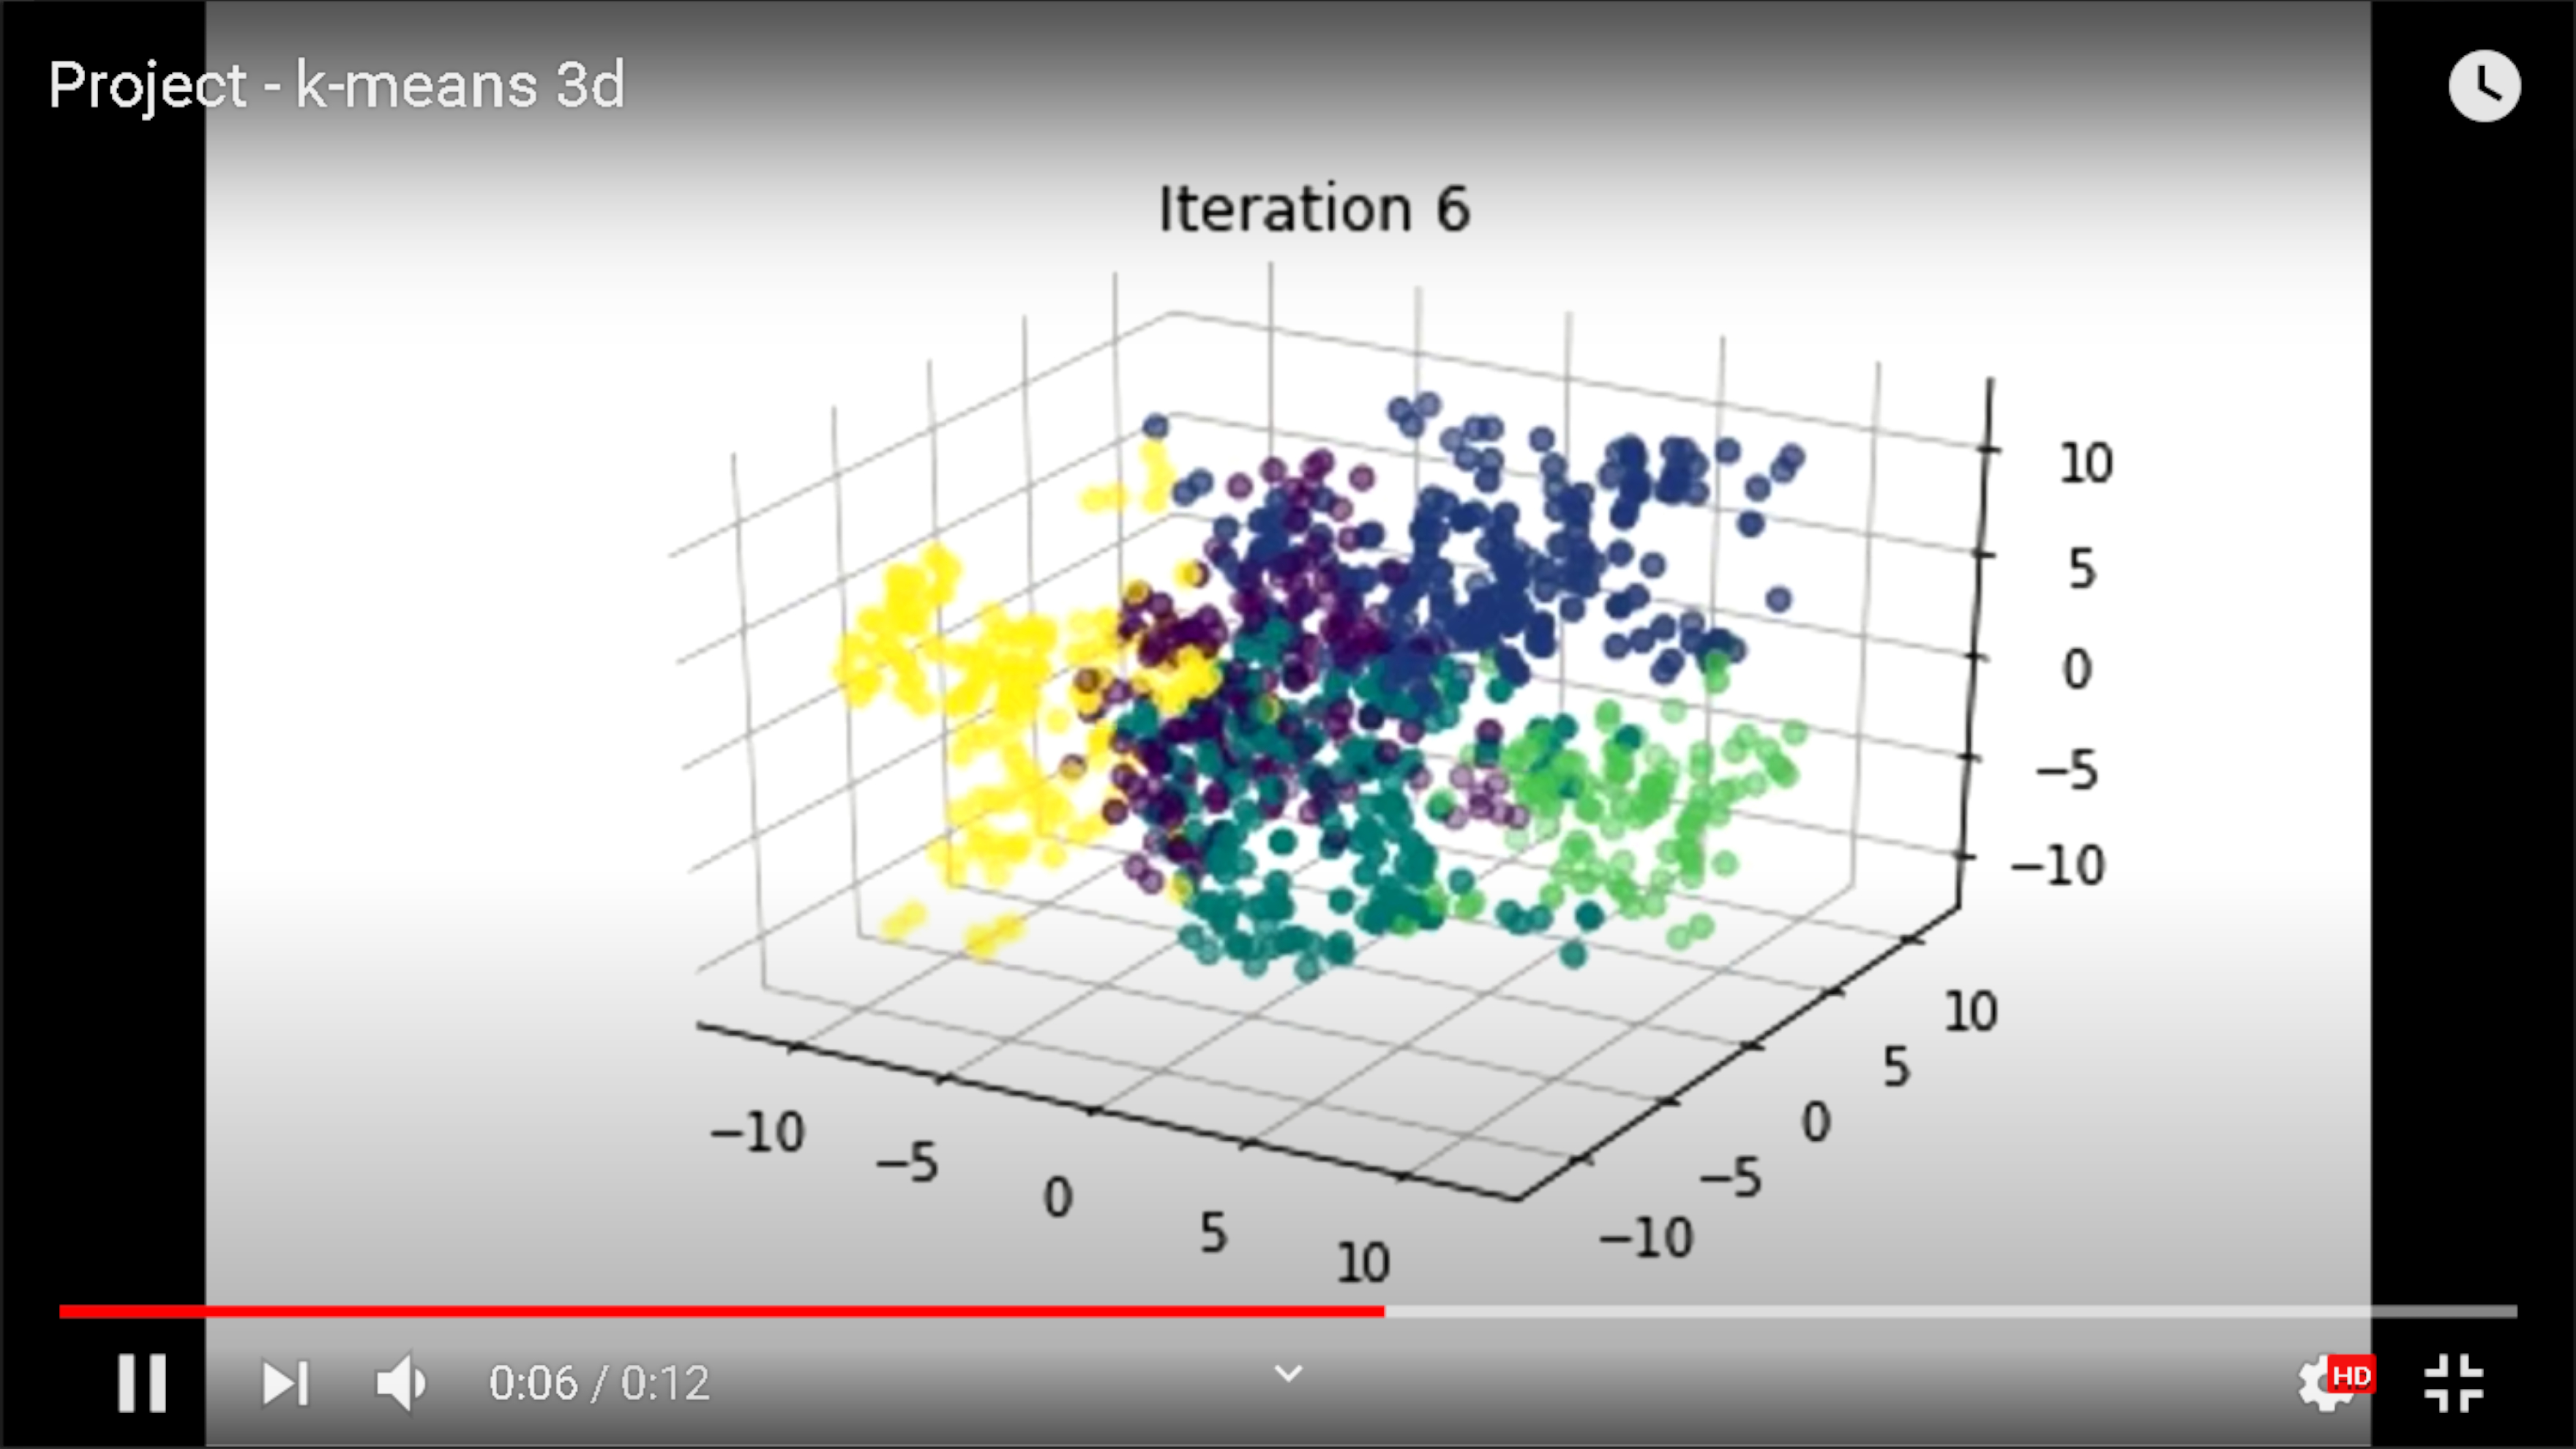
It's very common to see a 2D visual explanation of how the k-means algorithm works, but did you know you could make it in 3D? In this experiment I combined 3d visualization with k-means clustering. At the end of the project I show a video made with the plot of each iteration runned by the algorithm. [python]
Would you like to work with me? Awesome!
Get to know me!